
Software Interface
This chapter introduces the main interface layout, the tools available on the quick toolbar, and the project management options on the home page.
Main Interface
After launching the software, the main interface consists of the menu bar, data list, properties panel, display window, and quick toolbar.
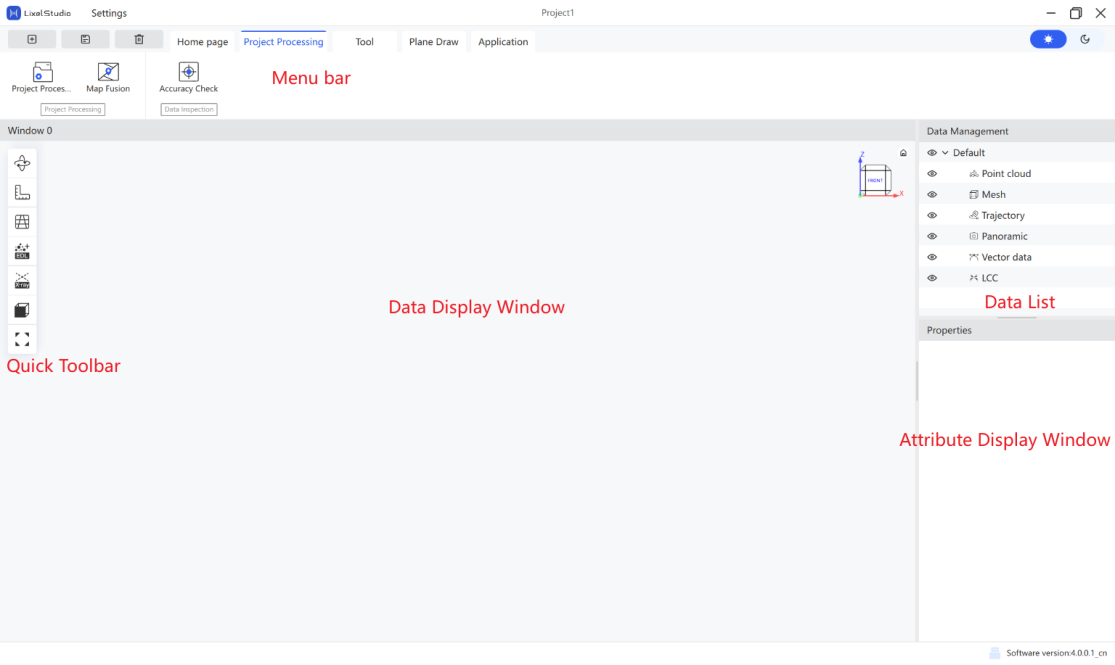
| Area | Description |
|---|---|
| Menu bar | Access to file, project processing, tools, drawing, applications, and settings |
| Data list | Displays point clouds, trajectories, and models loaded in the current project |
| Properties panel | Shows the properties of the selected data |
| Display window | The main 3D viewport for viewing and interacting with point cloud data |
| Quick toolbar | Common viewing tools such as rotation, measurement, and camera mode |
Quick Toolbar
The quick toolbar includes Rotation Type, Measurement Tools, Camera Mode, EDL View, Xray View, View Direction, Global View, Scale Bar, and Progress Bar.
Rotation Type
Double-click the left mouse button to set the rotation center. Two rotation types are available:
- Trackball
 : Rotate the view from any angle.
 - Turntable
 : Lock the roll axis to prevent the point cloud from flipping during rotation.
Measurement Tools
The measurement toolbar includes Point, Distance, Polyline, Area, Angle, Multi-Point, Density measurement, and Measurement Settings.

Point Measurement
Pick a point on the point cloud to read its coordinates, RGB values, and intensity.
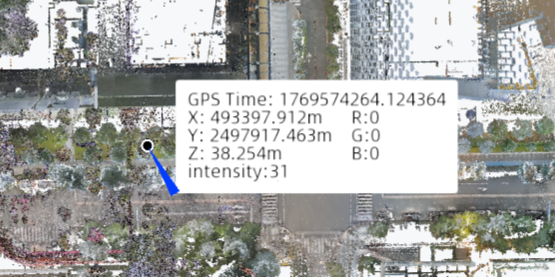
- Click Point in the measurement tools.
- Left-click a point in the point cloud to read its information. The information box can be dragged freely.
- Click the measurement tool button again to exit.
Distance Measurement
Select two points in the scene to generate a measurement line and display the result. The blue value is the straight-line distance between the two points; the white values are the projected distances along each axis.
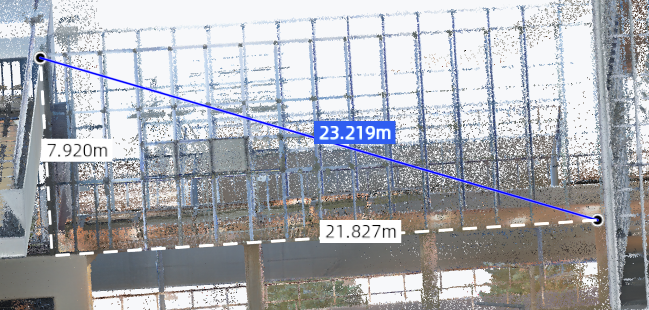
- Click Distance in the measurement tools.
- Left-click two points in sequence. The software generates the measurement line and displays the distance. Both points remain draggable, and the result updates in real time.
- Click the measurement tool button again to exit.
Polyline Measurement
Select multiple points in sequence to generate a chain of measurement segments. The blue value shows the total polyline length; hovering over a segment shows that segment's length.
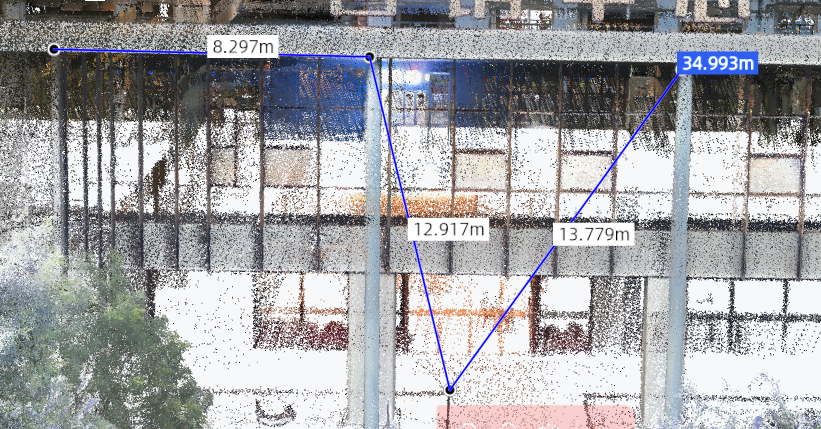
- Click Polyline in the measurement tools.
- Left-click points in sequence. The software connects each point and displays the results.
- While drawing, dashed lines show live component distances; once finished, the total length is shown in blue and segment lengths appear on hover. All points remain draggable.
- Press
Enteror double-click to finish drawing. Right-click to undo the last point. - Click the measurement tool button again to exit.
Area Measurement
Draw a polygon on the point cloud to read the projected area inside it.
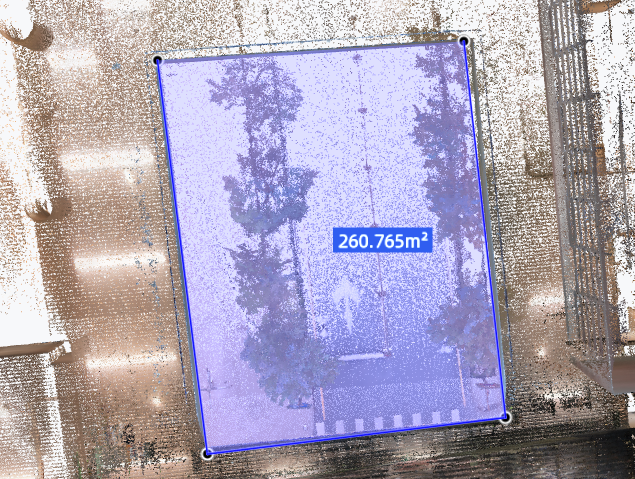
- Click Area in the measurement tools.
- Left-click points in sequence to form a closed polygon.
- Once closed, the total area is shown in blue; hovering over an edge shows its length.
- Press
Enteror double-click to finish drawing. Right-click to undo the last point. - Click the measurement tool button again to exit.
Angle Measurement
Click three points A, O, B in sequence to measure the angle ∠AOB.
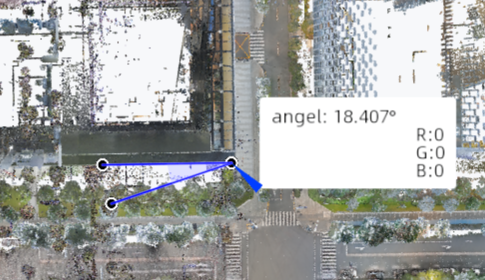
- Click Angle in the measurement tools.
- Left-click three points in sequence. The software uses the middle point as the vertex, generates two measurement lines, and displays the angle.
- All three points remain draggable, and the result updates in real time.
- Right-click during drawing to undo the last point.
- Click the measurement tool button again to exit.
Multi-Point Measurement
Pick multiple points and read their coordinates, RGB values, and intensity, with support for recording, labeling, and exporting.
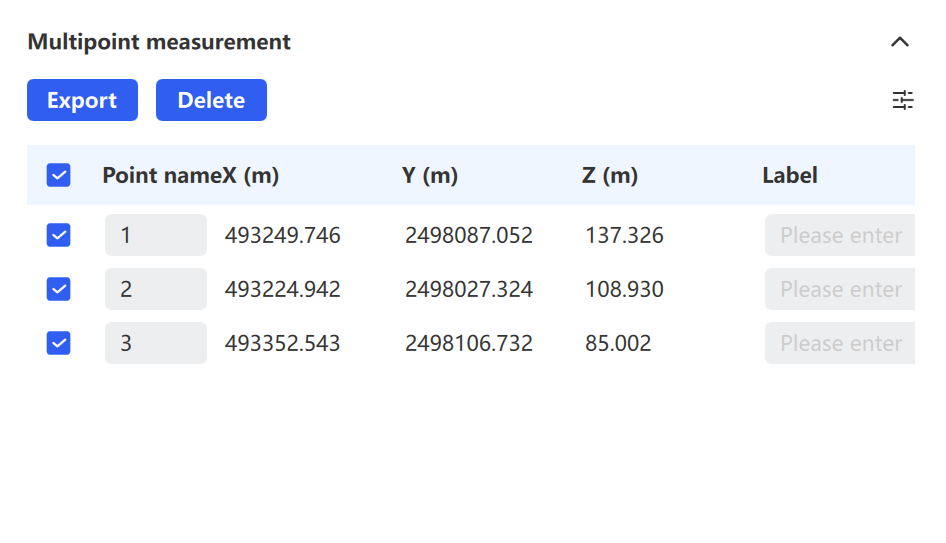
- Click Multi-Point in the measurement tools.
- Left-click points in the point cloud to read their information.
- (Optional) Customize the displayed columns, such as point name, coordinates, RGB, intensity, GPS time, and label.
- (Optional) Check the label column to add a tag to a point. Double-click the input field to enter text. English letters and numbers are currently supported.
- (Optional) Click Delete to remove a point.
- (Optional) Click Export to save the selected points as a
.txtor.csvfile. - Click the measurement tool button again to exit.
Density Measurement
Calculate the point cloud density of a selected area.
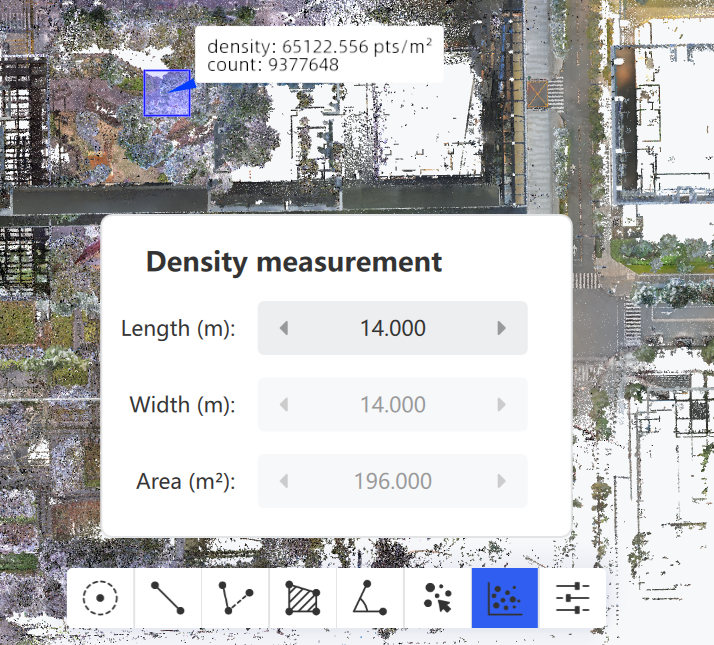
- Click Density in the measurement tools.
- Set the calculation range parameter (Length). By default, density is calculated per square meter.
- Left-click in the point cloud to read the density of that area.
- Click the measurement tool button again to exit.
Measurement Settings
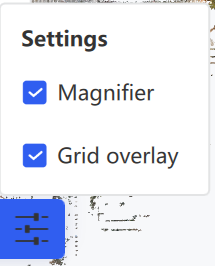
Supports custom display settings, letting you turn auxiliary displays such as the magnifier and grid assist on or off as needed.
Camera Mode
Camera mode switches the viewing perspective between two modes:
- Perspective
 : Mimics how the human eye views a 3D scene, with closer objects appearing larger.
 - Orthographic
 : Object size in the point cloud does not change with viewing distance.
EDL View
Enabling EDL (Eye-Dome Lighting)  enhances edge contours and surface detail in the active window. EDL intensity can be adjusted under Settings → Rendering Display.
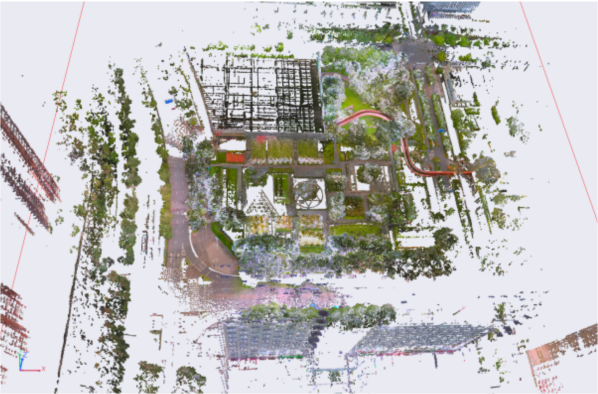
EDL off
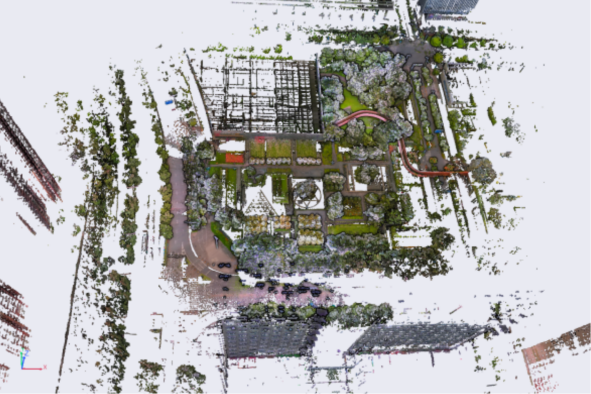
EDL on
Xray View
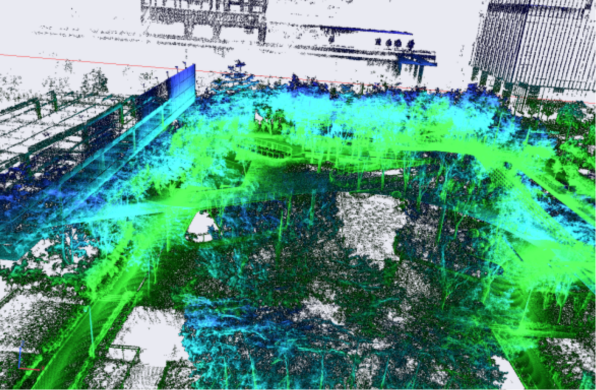
Enabling Xray mode  makes the point cloud translucent, revealing internal structure. Xray exposure can be adjusted under Settings → Rendering Display.
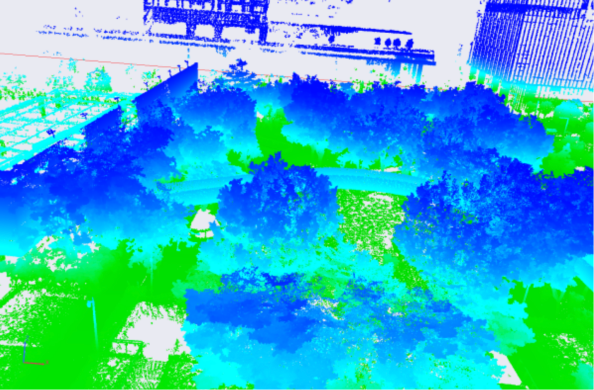
Xray off
Xray on
View Direction
Switch the camera to a standard view direction.
Front View  : Views from -y to +y, with the plane being x-z.
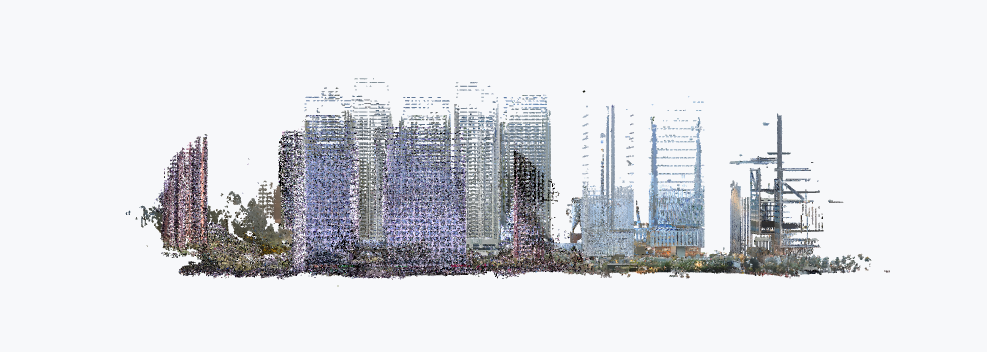
Left View  : Views from -x to +x, with the plane being y-z.
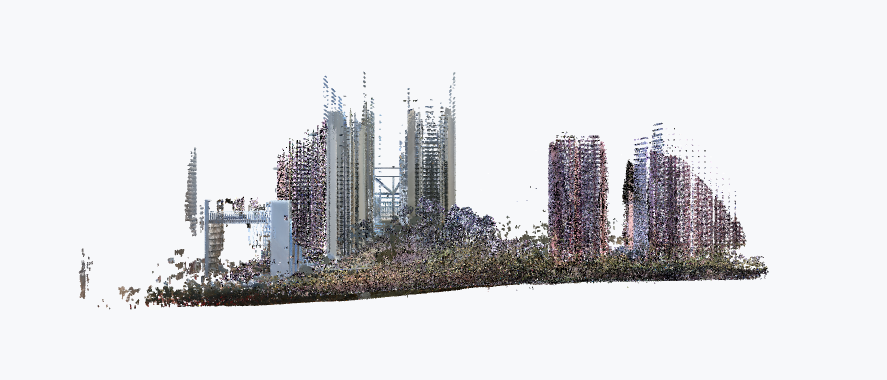
Top View  : Views from +z to -z, with the plane being x-y.
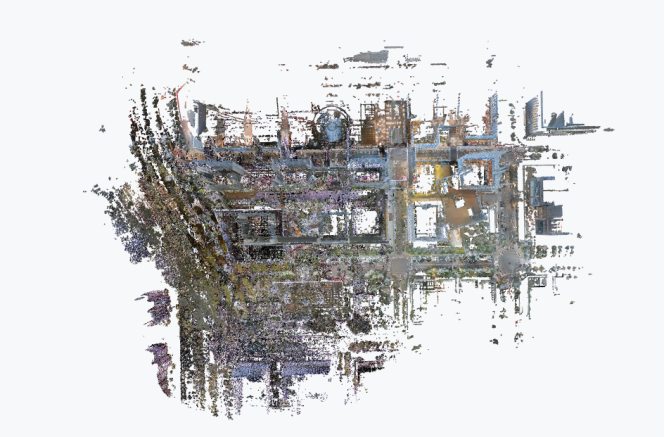
Back View  : Views from +y to -y, with the plane being x-z.
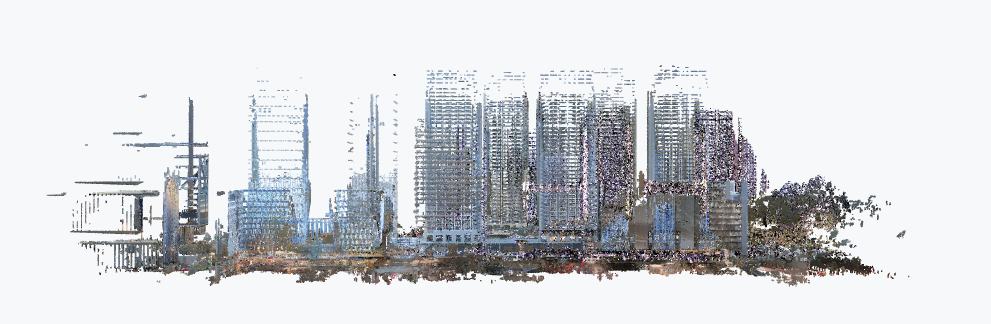
Right View  : Views from +x to -x, with the plane being y-z.
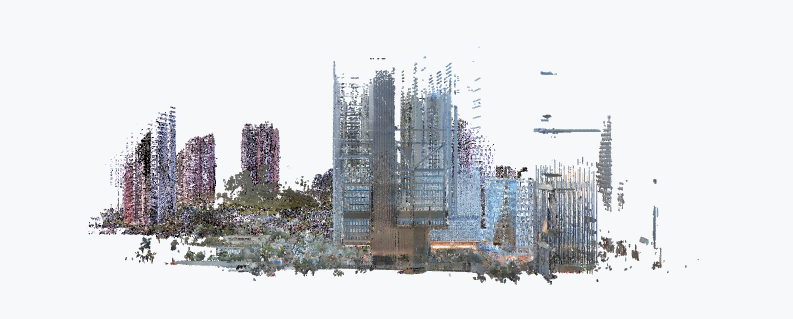
Bottom View  : Views from -z to +z, with the plane being x-y.
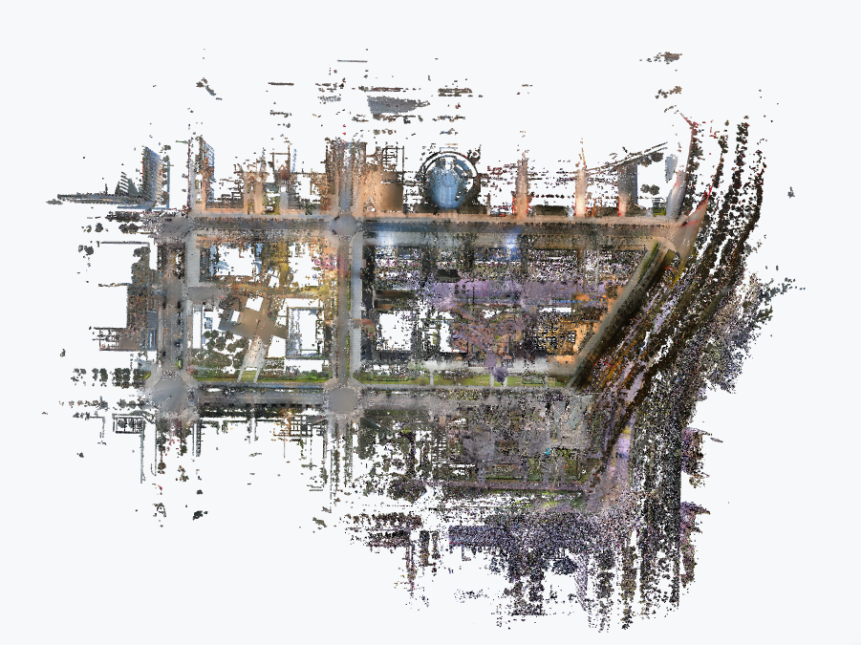
Global View
Click Global View  to reset the view, returning the point cloud to its initial top-down orientation, centered in the window.
Scale Bar
The scale bar provides a visual reference for spatial distance in the current view. A line segment of fixed pixel length maps to a real-world physical distance, helping you gauge scale during planning or measurement.

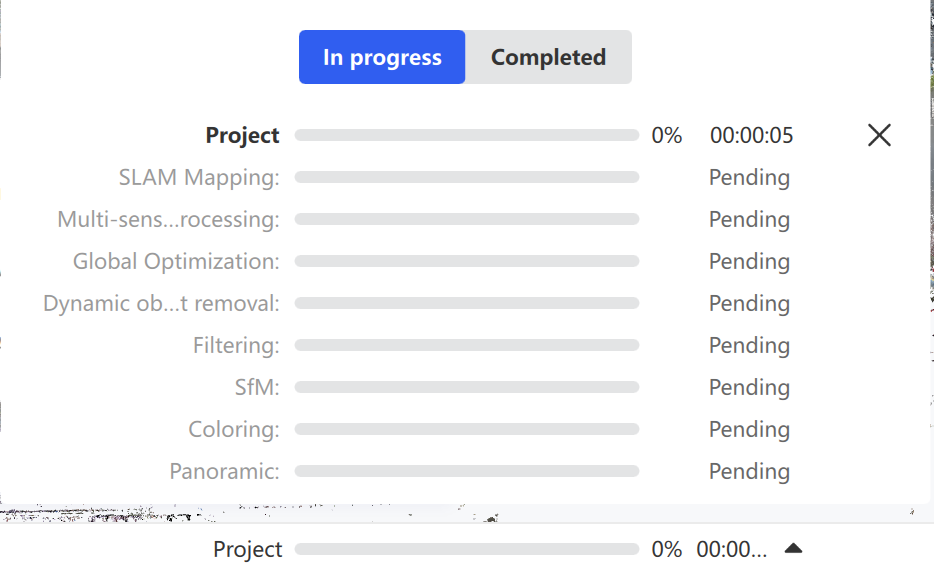
Progress Bar
The progress bar is a real-time monitor for the processing workflow, showing overall status alongside a breakdown of each stage from raw data processing through final model output.
Home Page
The home page provides base functions including About Lixel Studio, Check for Updates, Help, and Authorization Activation. The main view lists recently opened projects for quick access, and offers New Project, Open Project, and project management options including Open Project Path, Rename Project, and Remove Project.
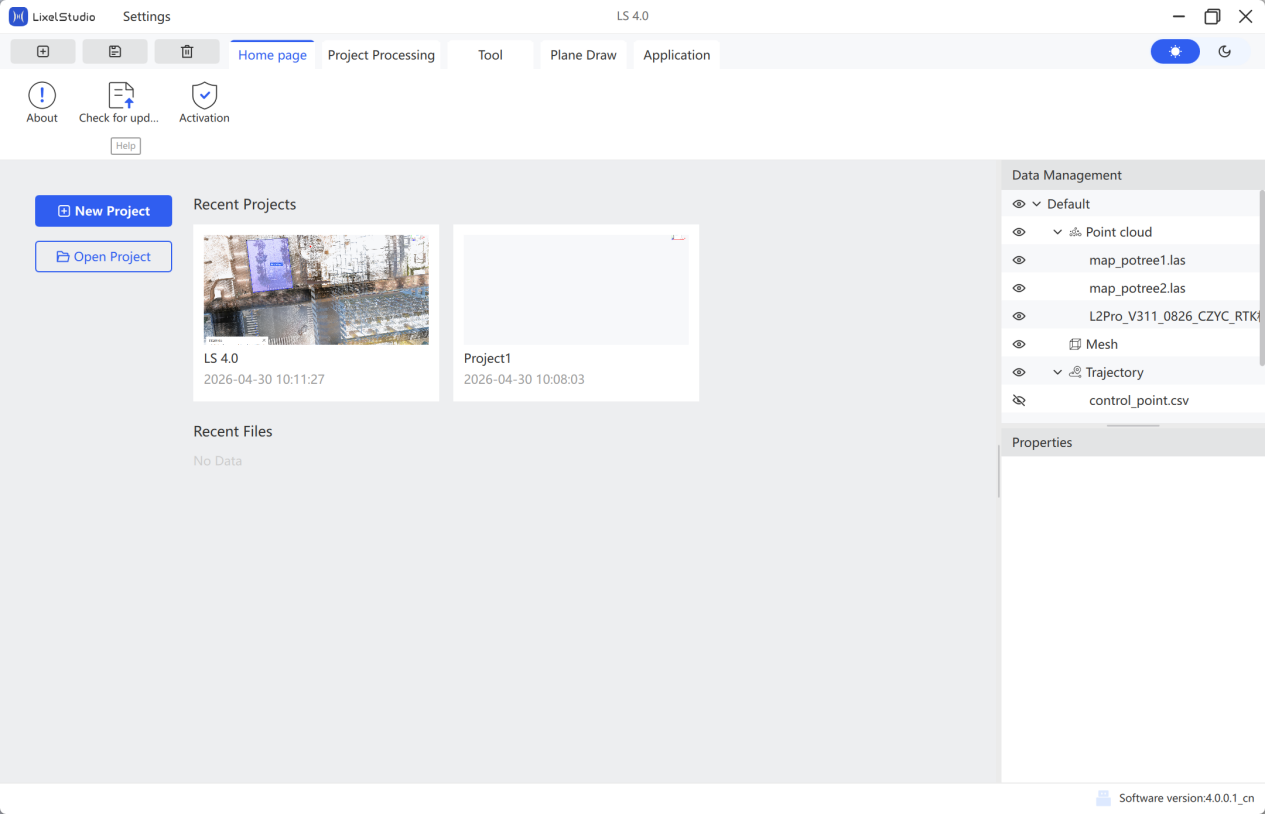
New Project
Lixel Studio manages data using a project structure. Before entering the main interface, a project must be created.
- Click New Project.
- Choose a project path, create a folder if needed, enter a file name, and confirm.
Open Project
Open an existing project file.
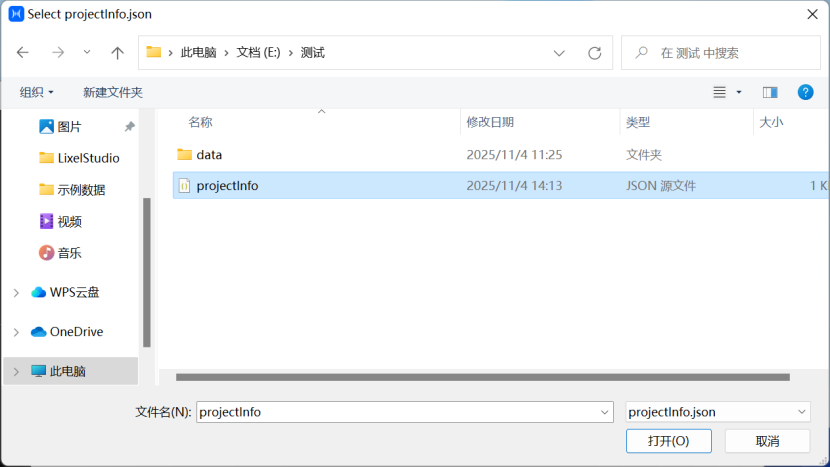
- Click Open Project.
- Select an existing project and click Open.
Open Project Path
Open the folder containing an existing project file.
Remove Project
Removes the project from the Lixel Studio startup project list. The project data remains on disk.